
Filter by
SubjectRequired
LanguageRequired
The language used throughout the course, in both instruction and assessments.
Learning ProductRequired
LevelRequired
DurationRequired
SkillsRequired
SubtitlesRequired
EducatorRequired
Explore the Cartography Course Catalog
 Status: Free Trial
Johns Hopkins University
Skills you'll gain: Data Visualization Software, Ggplot2, Statistical Visualization, Data Presentation, Tidyverse (R Package), Data Storytelling, Scatter Plots, Exploratory Data Analysis, R Programming, Graphing, Histogram, Animations

Coursera Project Network
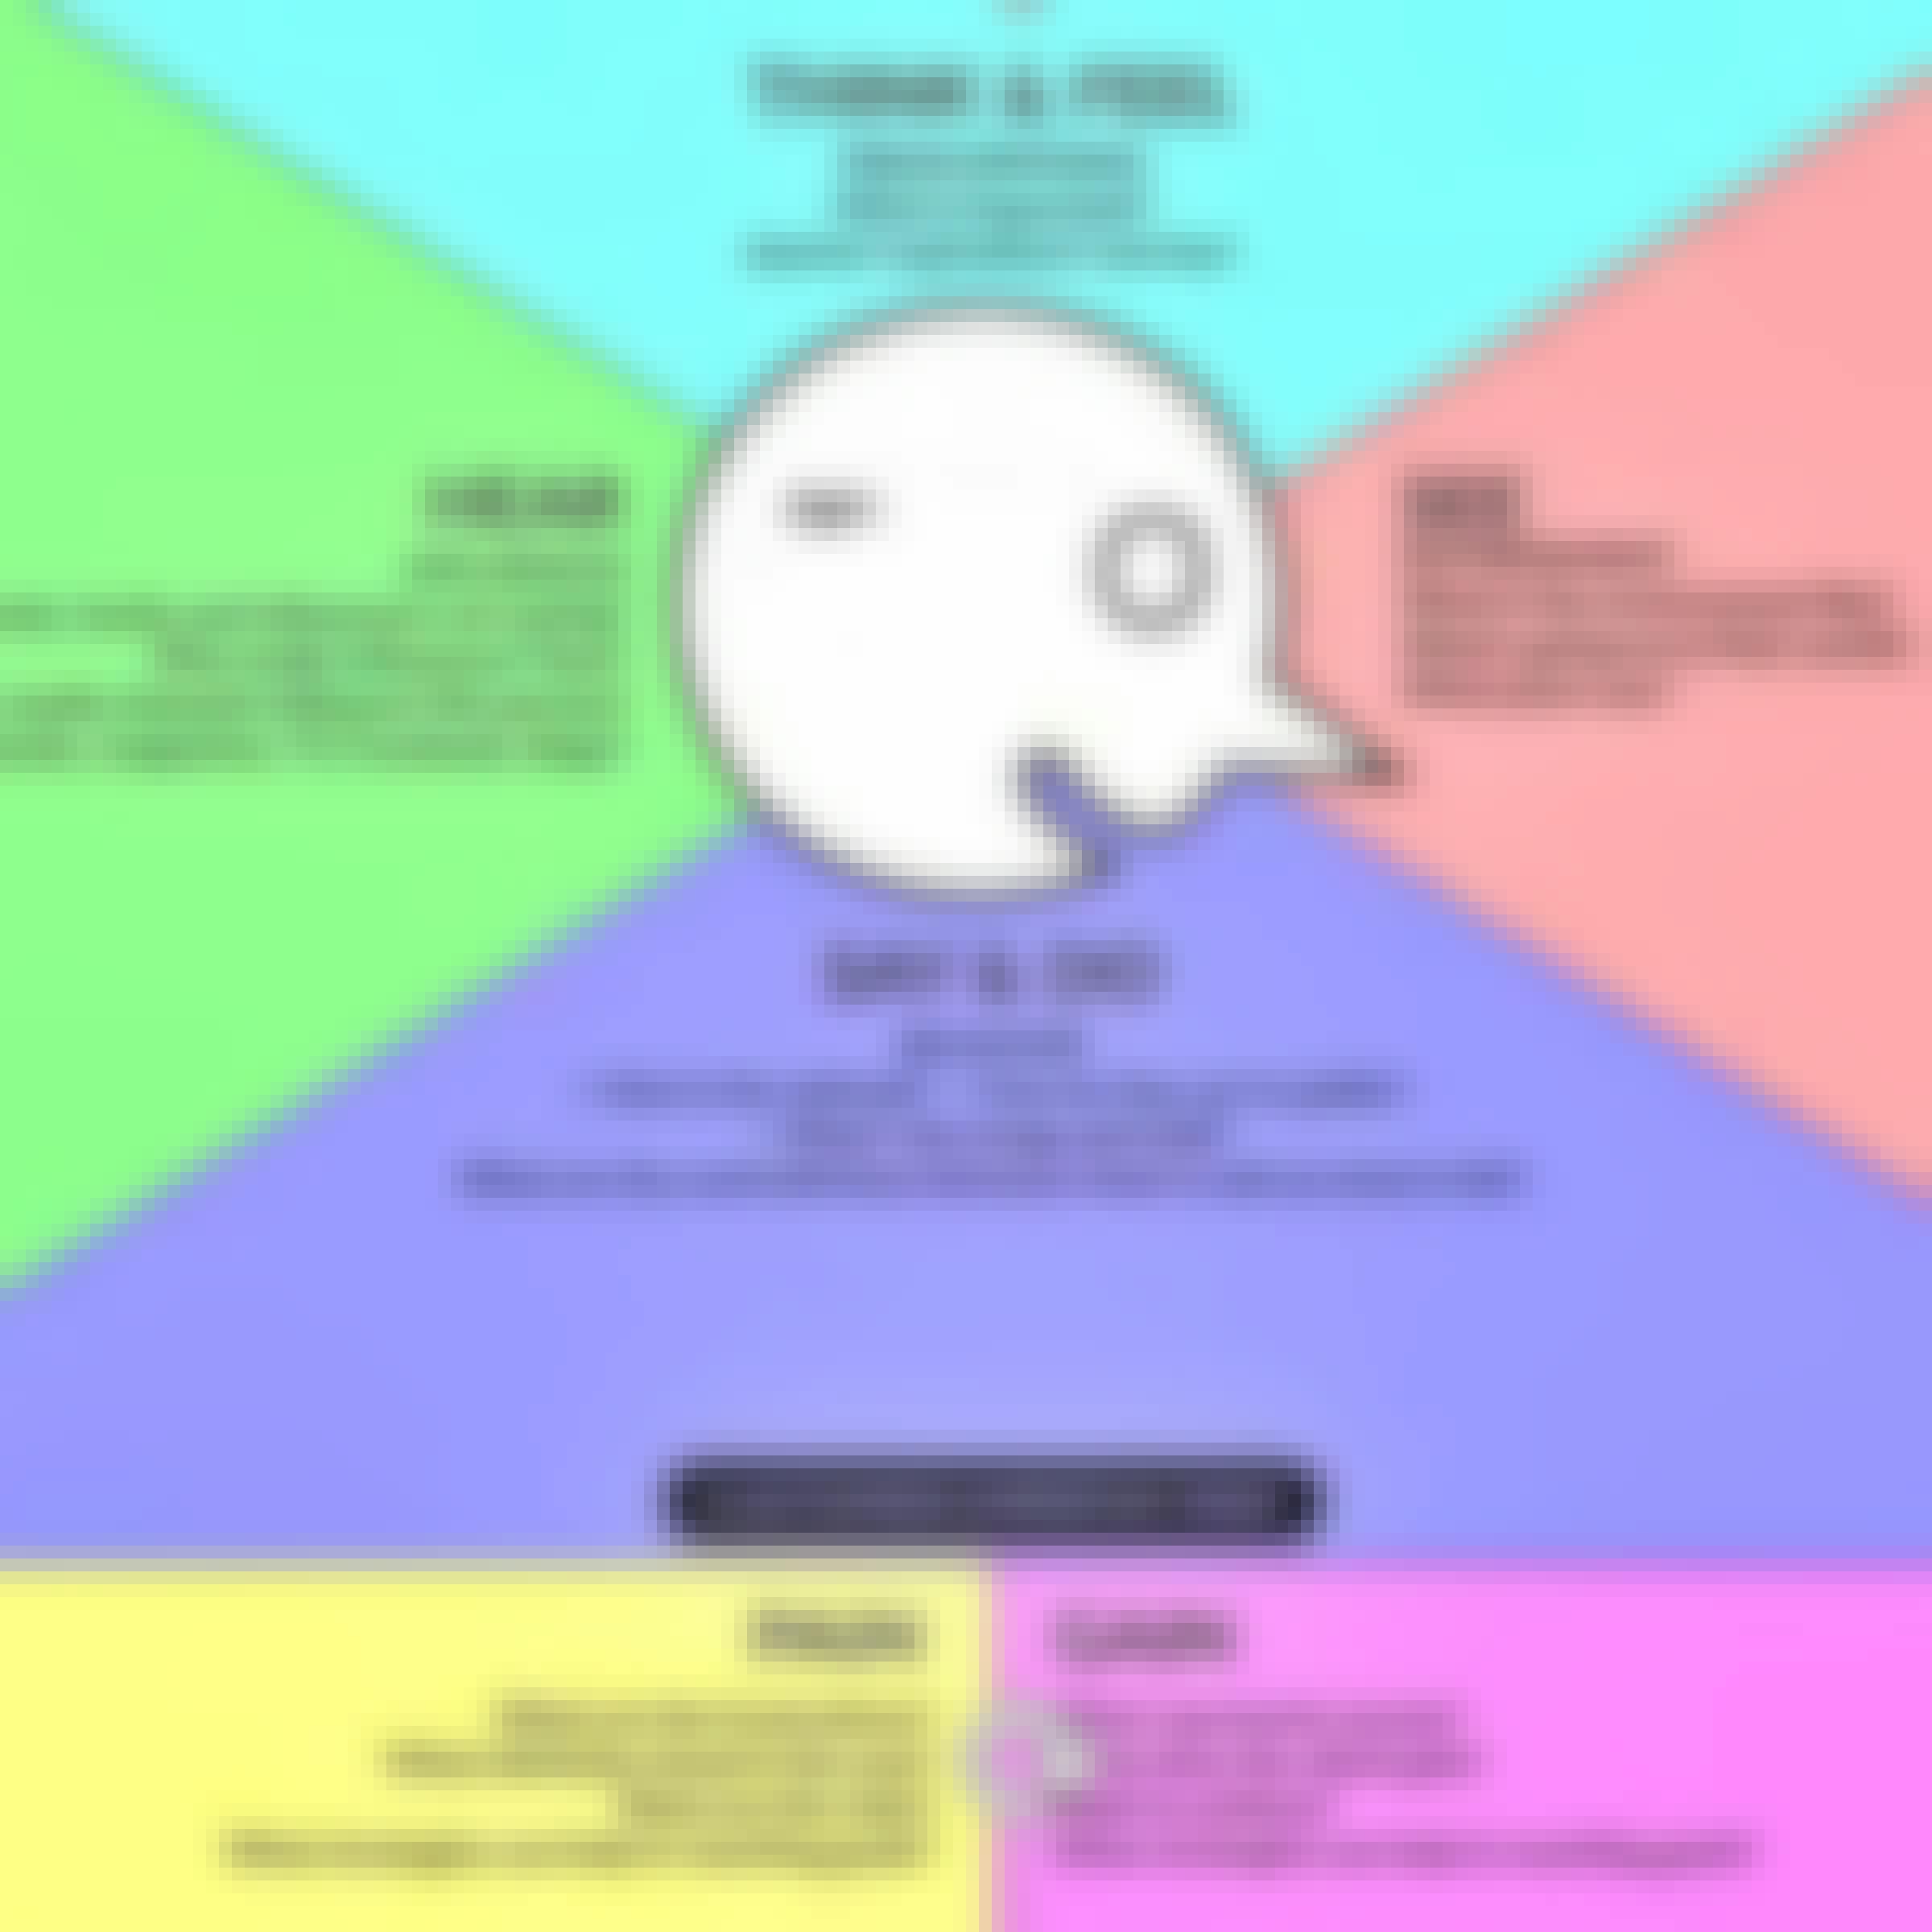
Skills you'll gain: Canva (Software), Infographics, Color Theory, Data Visualization, Multimedia, Presentations, Data Sharing, Design Elements And Principles

Coursera Project Network
Skills you'll gain: Data Visualization, Plot (Graphics), Data Visualization Software, Time Series Analysis and Forecasting, Statistical Visualization, Box Plots, Anomaly Detection, Plotly, Statistical Analysis, Data Analysis, Exploratory Data Analysis, Python Programming
 Status: Free Trial
University of Colorado Boulder
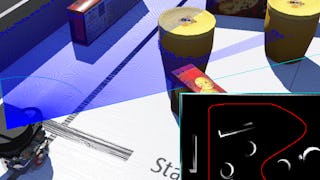
Skills you'll gain: Control Systems, Machine Controls, Data Mapping, Automation Engineering, Process Control, Global Positioning Systems, Simulation and Simulation Software, Engineering Calculations, Linear Algebra, Algorithms, Applied Mathematics, Python Programming, Computer Programming
Coursera Project Network
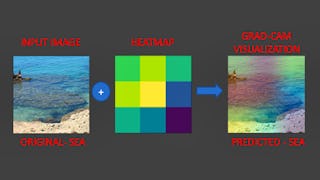
Skills you'll gain: Keras (Neural Network Library), Image Analysis, Deep Learning, Tensorflow, Computer Vision, Artificial Intelligence, Artificial Neural Networks, Applied Machine Learning, Data Processing, Python Programming, Machine Learning, Visualization (Computer Graphics)
Coursera Project Network
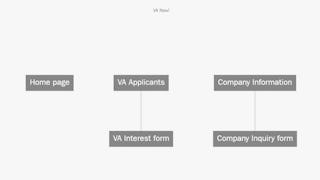
Skills you'll gain: Wireframing, Mockups, Web Content, Information Architecture, User Experience, Web Design, Collaborative Software
 Status: Free
Coursera Project Network
Skills you'll gain: Wireframing, Prototyping, User Interface and User Experience (UI/UX) Design, User Interface (UI) Design, Mockups, Usability, User Experience Design, User Centered Design, UI Components, Design Software, User Flows
Coursera Project Network
Skills you'll gain: UI/UX Research, User Research, User Experience, Persona (User Experience), User Experience Design, User Centered Design
 Status: NewStatus: Free Trial
University of Colorado Boulder
Skills you'll gain: Plotly, Matplotlib, Seaborn, Data Visualization Software, Interactive Data Visualization, Data Visualization, Statistical Visualization, Scatter Plots, Box Plots, Histogram, Heat Maps, Regression Analysis
 Status: Free Trial
Johns Hopkins University
Skills you'll gain: Data Visualization, Data Visualization Software, Graphic and Visual Design, Data Presentation, Design Elements And Principles, Data Storytelling, Exploratory Data Analysis, Data Mapping

Skills you'll gain: Geospatial Information and Technology, GIS Software, Spatial Data Analysis, Geographic Information Systems, Applied Machine Learning, Data Analysis Software, Environmental Monitoring, Image Analysis, Unsupervised Learning, Machine Learning Methods, R Programming, Data Processing, Data Transformation, Dimensionality Reduction, Open Source Technology

Coursera Project Network
Skills you'll gain: Collaborative Software, Education Software and Technology
In summary, here are 10 of our most popular cartography courses
- Visualizing Data in the Tidyverse: Johns Hopkins University
- Crea un mapa mental interactivo usando Canva: Coursera Project Network
- Time Series Data Visualization And Analysis Techniques : Coursera Project Network
- Robotic Mapping and Trajectory Generation: University of Colorado Boulder
- Explainable AI: Scene Classification and GradCam Visualization : Coursera Project Network
- Build a Website Map with Jumpchart: Coursera Project Network
- UI/UX Design with Sketch: Travel Booking App: Coursera Project Network
- Communicate UX Research with Empathy Maps in Miro: Coursera Project Network
- BiteSize Python: Data Visualization: University of Colorado Boulder
- Foundations of Data Visualization: Johns Hopkins University


